


Damn – this article is epic…
Aaron here. Let me start by saying; this is no 300 word post, slapped together for the sake of pushing out content. This is an article with real substance – something you can sink your teeth into.
My buddy Fil Lorinc (who you may recognise from ‘The One Thing‘) recently mentioned to me, that he was keen to start writing about some of his work as a quantitative trader. When I heard this, I knew it would be a killer idea to have him write an article for Chat With Traders, so you too can take on board some of his valuable insight.
If you’re reading this and thinking ‘not relevant to me, I’m a discretionary trader’ – well not so fast. Before you start running in the opposite direction, let me tell you this article is actually intended for you. Feeling special now?
Fil makes no attempt to ‘convert’ you into a quant, nor say a particular style of trading is better than the other. Instead, he highlights the value of knowing your numbers, and knowing the likely outcome as a direct result.
Everything going to plan, this is the first installment of weekly articles (with serious depth), contributed by a few selected traders. If you like, subscribe here to be notified of each new post.
Now let me pass you over to Fil, you’re in safe hands.
Initially I wanted to title this piece: “Quantifying Your Trading Strategy or Idea: 3 Easy Steps”. The problem therein was such a title is implicitly misleading and in my opinion gimmicky; I desire to be neither.
When dealing with as complex a problem as understanding capital markets, investments, trading, etc. (let alone quantification and systemization of those problem spaces) it should be evident that there is no simple catchall x-step process. There are, however, reasonable starting points from which it makes sense to launch the journey; here would be my three:
- Quantify and parameterize the problem space
- Identify an appropriate platform/environment in which to carry out the analysis
- Build/adopt a reusable code base for the testing and implementation of existing and future strategies/ideas
Quantify / Parameterize
Quantification in this context means identifying what exactly it is that you’re doing. Maybe you’re a trader of moving averages, maybe you take entries in the direction of breakouts or maybe you’re a good old fashioned coin-flipper. The beauty is, almost anything that you’re doing can in fact be quantified.
Trading is more than merely the challenge associated with crafting a single pursuable strategy; it is best viewed as a complex problem space. The term “problem space” is therefore integral and the reference to quantification of the space as a whole is very intentional. There are so many considerations over and beyond the myopic objective of strategy generation that it can be enough to make even the most seasoned of traders’ head spin.
So in an attempt to keep both feet on the ground, let’s back up and use as an example the parameterization of the most important component of your trading strategy: your capital.
What sort of parameters need to bind your capital in order to maximize your likelihood of success as a trader? Ironically, too few traders ask this question. Instead they are quick to delve straight into very specific trading strategies; they are focusing on the battle, not the war.
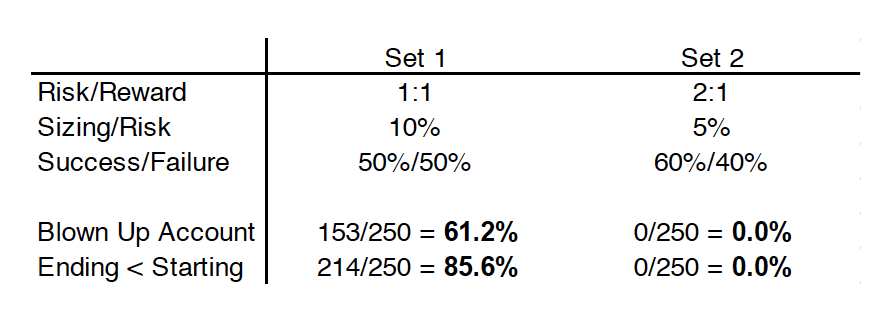
In a nutshell the war should look something like this:
Click image to view full size.
What we have here are the foundational components every trader should run and analyze prior to even setting out to build a strategy. These components are:
A) Risk/Reward
B) Position Sizing
C) Success/failure statistics
D) Overall account risk
These four basic parameters are really all that is needed in order to demarcate what is and what isn’t going to work, which should then serve as a guide once a strategy is ready to be built/quantified. Let’s dig in with a simple example to illustrate.
What do the inputs to these parameters look like for the average trader (whether they know it consciously or not)?
A) Risk/Reward
Many folks are 1:1 traders, perhaps lower. If they risk $1.00 on a trade they somewhat arbitrarily expect to capture $1.00 to the upside
B) Position Sizing
Many traders trade too big and scale in the wrong direction, meaning their % capital at risk per trade is too high and they increase their trade size as they lose capital
C) Success/failure statistics
50%. While this may not sound like much, for many traders 50% is actually a gracious assumption.
D) Overall account risk
This somewhat ties back to sizing, but the takeaway is the average trader risks too much too quickly.
So what does that look like in a $50,000 account?
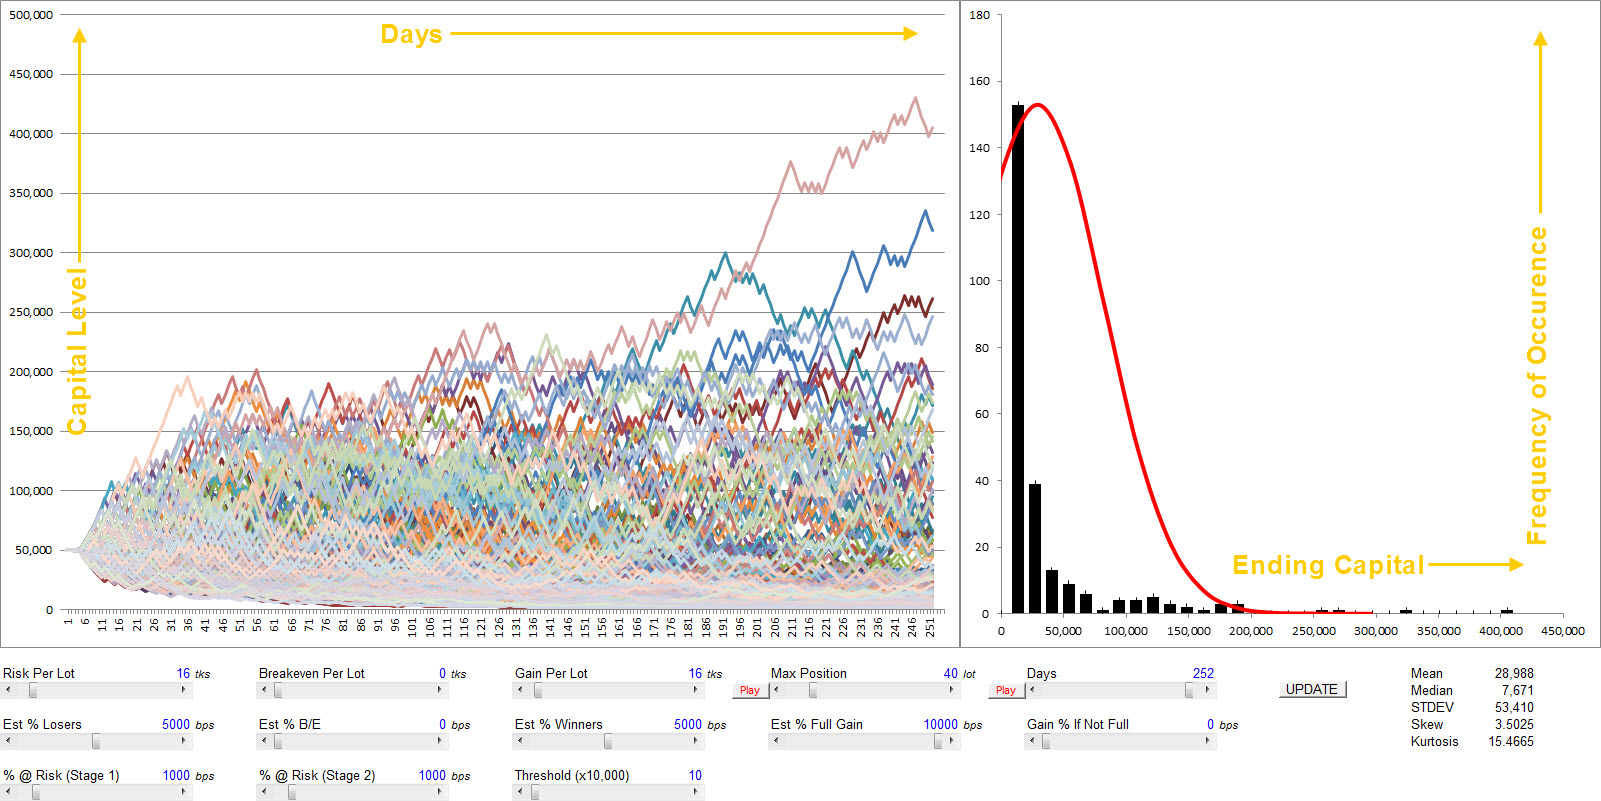
Click image to view full size.
The results are downright poor… So what is this tool doing at a high level?
Given the inputs laid out in our hypothetical the tool runs a Monte Carlo path-dependency analysis (250 draws in this case) of your PnL via the use of a little bit of VBA (Visual Basic for Applications). It answers the question every trader wants (or at least SHOULD want) to know:
“What will my account look like if I trade this way?”
In our stylized example we see we’ve successfully blown up the account 153/250 = 61.2% of the time. Nice. In fact, our closing account value is below our starting point 214/250 = 85.6% of the time. But what about that one $405k banger? Be my guest; trading like this you’ve got a 1/250 = 0.4% chance…
The question I’m about to ask should hopefully be apparent by this point: where do I need to be in order to produce consistently profitable PnL? This threshold, this “parameterization”, should become the litmus test for any and all strategies you build.
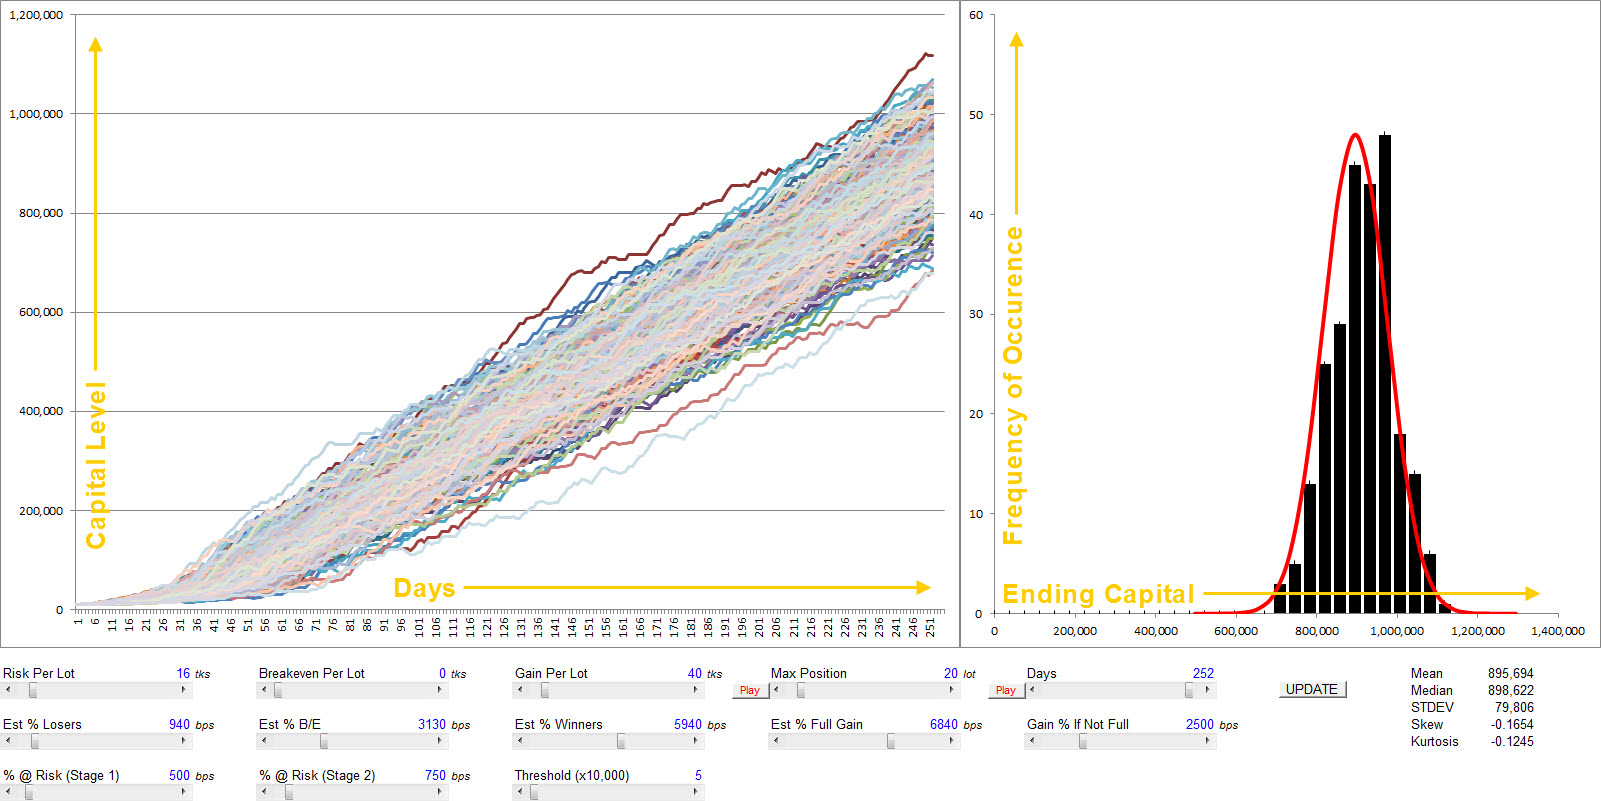
Let’s make a couple of quick adjustments and see what happens.
- Firstly, we need to be targeting a better RR (risk/reward), say at least 2:1
Side note: When I quote RR 2:1 I mean we are risking 1 unit to potentially gain 2 units. I know this is backwards in terms of the reading of the ratio but it’s the way it’s quoted. If you prefer to call it reward/risk for internal consistency I can’t say I blame you. - Secondly, we need to risk far less capital; at max 5%.
- Thirdly, we should seek to trade better than 50%. Good traders trade in the 60’s. Great traders sometimes hit the 70’s. We’re good traders, let’s give ourselves 60%.
Prepare to be amazed:
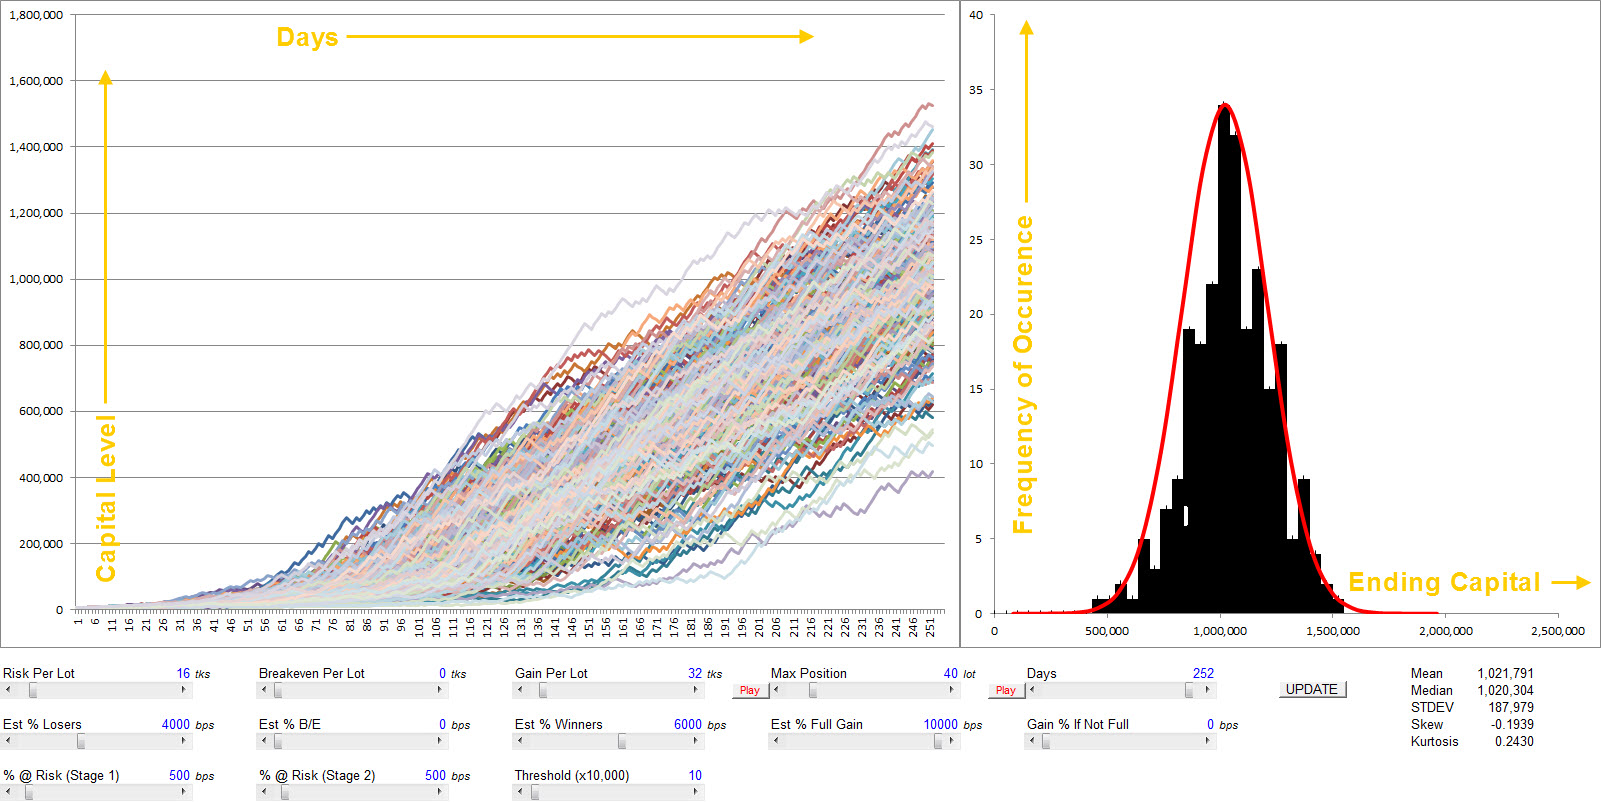
Click image to view full size.
With relatively minimal change, we’ve gone from this to this:
Well worthwhile exercise.
The logical progression from parameterizing on the capital side of the equation to the strategy side is hopefully made more approachable through this example. Conceptualize the relevant components/variables, build a model/methodology, and analyze the outputs; these basic steps form the foundation of the evaluative process in systemizing your trading.
Platform / Environment
This is the type of question which is best asked at the beginning of one’s endeavors into trading rather than the midst of them, but as so happens to be the case (along with the countless other paradoxes in the world of trading) it is very difficult to resolve this question on account of the prerequisite knowledge and planning required. Nonetheless, this is an ideal time to reference the old adage “measure twice, cut once.” It’s also worth mentioning that the expectation here is not to nail things perfectly on the first go else freeze in analysis-paralysis. With emphasis on those last words, questions worth asking yourself:
- What sort of ideas would I like to test
- What data do I need to effectively test those ideas
- What am I willing to pay for infrastructure (platform, data, peripherals)
- What integrations do I require (for example: linkages between the testing and execution environment, APIs to 3rd party applications, and so on)
While this can certainly come across as daunting, the good news is that very often this is an organic process. And as it goes with organisms, the quantification of your trading will grow and adapt as you proceed.
For purposes of discussion here we’ll be working with a free retail platform called ThinkOrSwim. For those of you who just rolled their eyes or are literally on the verge of jumping ship due to “lack of sophistication” bear with me and allow me to explain. I’m an avid believer that learning through doing is the most impactful way in which to master a skill or improve proficiency.
As much as I’d love to jump straight into TradingTechnologies’ X_Trader algo lab, such an approach would be prohibitive for a number of reasons. ThinkOrSwim is far from an ideal environment and my grievances of it are many HOWEVER, it’s free, it’s quite functional, and it allows for virtually immediate interaction. From my origins I also happen to know it very well, which aids in demonstration. A quick example:
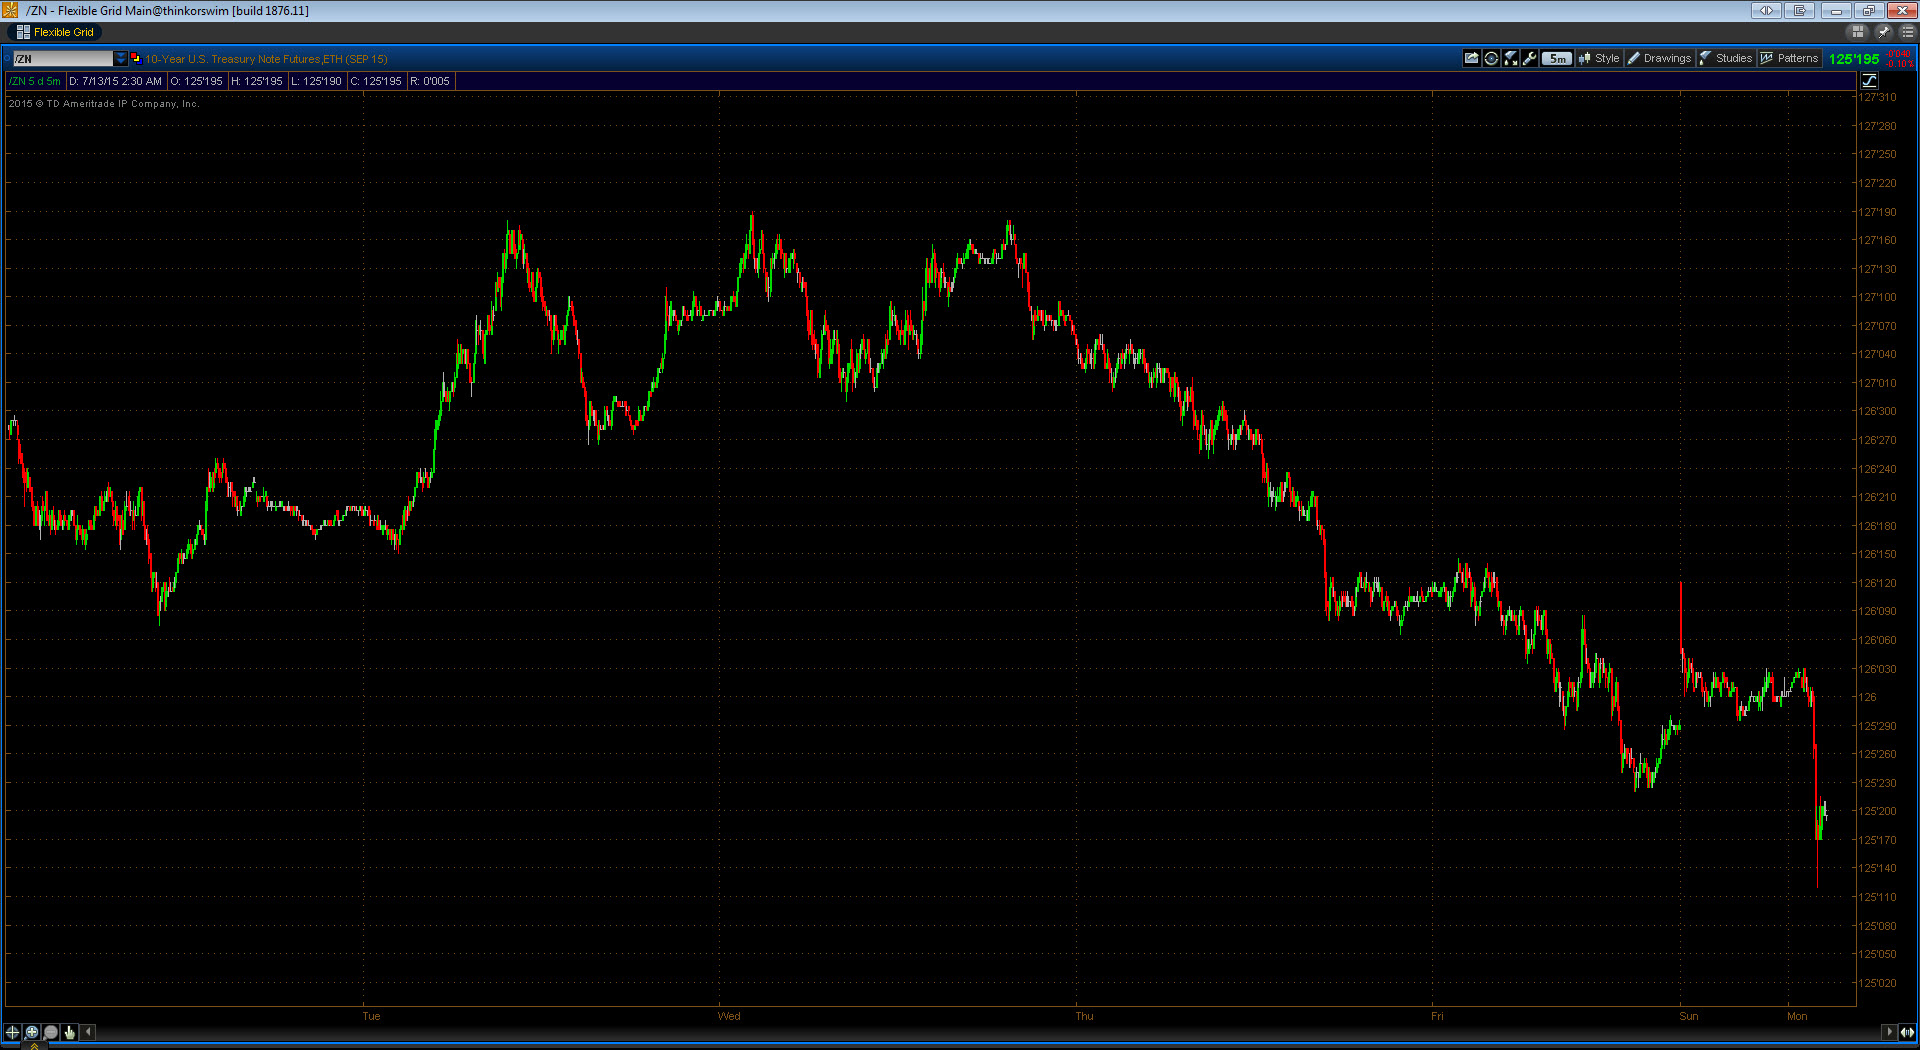
Click image to view full size.
Pictured is a fully autonomous trading system in the US Ten-Year Note futures complete with automated signaling/notification, visualization, statistics, and PnL logging. Not bad for retail… even better for free.
In regards to the considerations previously listed, ThinkOrSwim fits them in the following manner:
1) What sort of ideas can I test?
- Price structure and other fundamental data driven trading ideas
- Meta-data driven strategies will not be readily testable (barring a few creative workarounds)
2) What infrastructure/data do I have available?
- Broker, platform, and data feeds all consolidated under the ThinkOrSwim roof
· Brokerage – TDA (and its affiliates)
· Platform – ThinkOrSwim
· Data – Equities/Options => InteractiveData, Futures/Forex => dxFeed - Basic price/volume/orderbook data (extremely basic tick data)
- Some other fundamentals; function calls to these data are limited, however
3) What do I pay?
- Nothing
4) What integrations do I get?
- Sadly, none… certainly a downside. A terrible DDE plug exists to Excel but it’s really not a pragmatic way for building any form of overarching structure
Certainly far from perfect, but it’s a workable start and a reasonable point of origin. The process map from here can be whatever the user envisions, whether that’s a path toward full-automation or a more “hands-on” approach entailing semi-automated strategies where the analysis and computation is handled programmatically but the execution still rests at the left-click of the user.
The chief takeaway is to always be thinking forward, anticipating the next stage of development and always working diligently to encompass as much of the problem space as possible rather than simply producing “one-off” solutions. Such an approach is not only best-practice in terms of design and testing work, but will almost surely yield a greater degree of productivity and ultimately success as a trader.
Code Base
Before delving into this otherwise massive topic, let’s zoom out for a minute.
The big picture here is getting from this:
Click image to view full size.
To something like this:

Click image to view full size.
Which, admittedly, is a fair bit of work. The idea is to arrive at this point in such a manner so that the bulk of what we have is reusable. The code generating this particular example has been written in such a way as to allow modulation based on the redefinition of merely two variables. That begs the question: what are the things that stay the same from system to system?
The answer: it depends on how dynamically the system has been developed. While there is a tradeoff implicit in designing a progressively dynamic system (for example one that accounts for greater number of inputs, or allows for greater number of entry/exit methods, etc.) the back-end benefit of this work will almost always pay off.
To reference the illustrated system once again, the vast majority of the executable code (over 80% in fact) is actually dedicated to items such as trading-hours configurability (running RTH, ETH, or composite hours), trade direction switching (analyzing long-only, short-only, or long/short implementations), excursion visualization, and the list goes on. The same is true for the code controlling the visual mapping of the strategy elements along with aggregated statistics. For example:
Mapping (marking out where things occur)
- The definitions of entries/exits are assumed to be modular, but the logic controlling their mapping is constant
Data collection and statistics
- Trade count, %Winners, %Losers, Max Favorable Excursion, Max Adverse Excursion, Average RR, really any metric we wish to assess can be written once and then reused in an infinite amount of systems
Take the following 19 lines of code that control the PnL plot from the system:
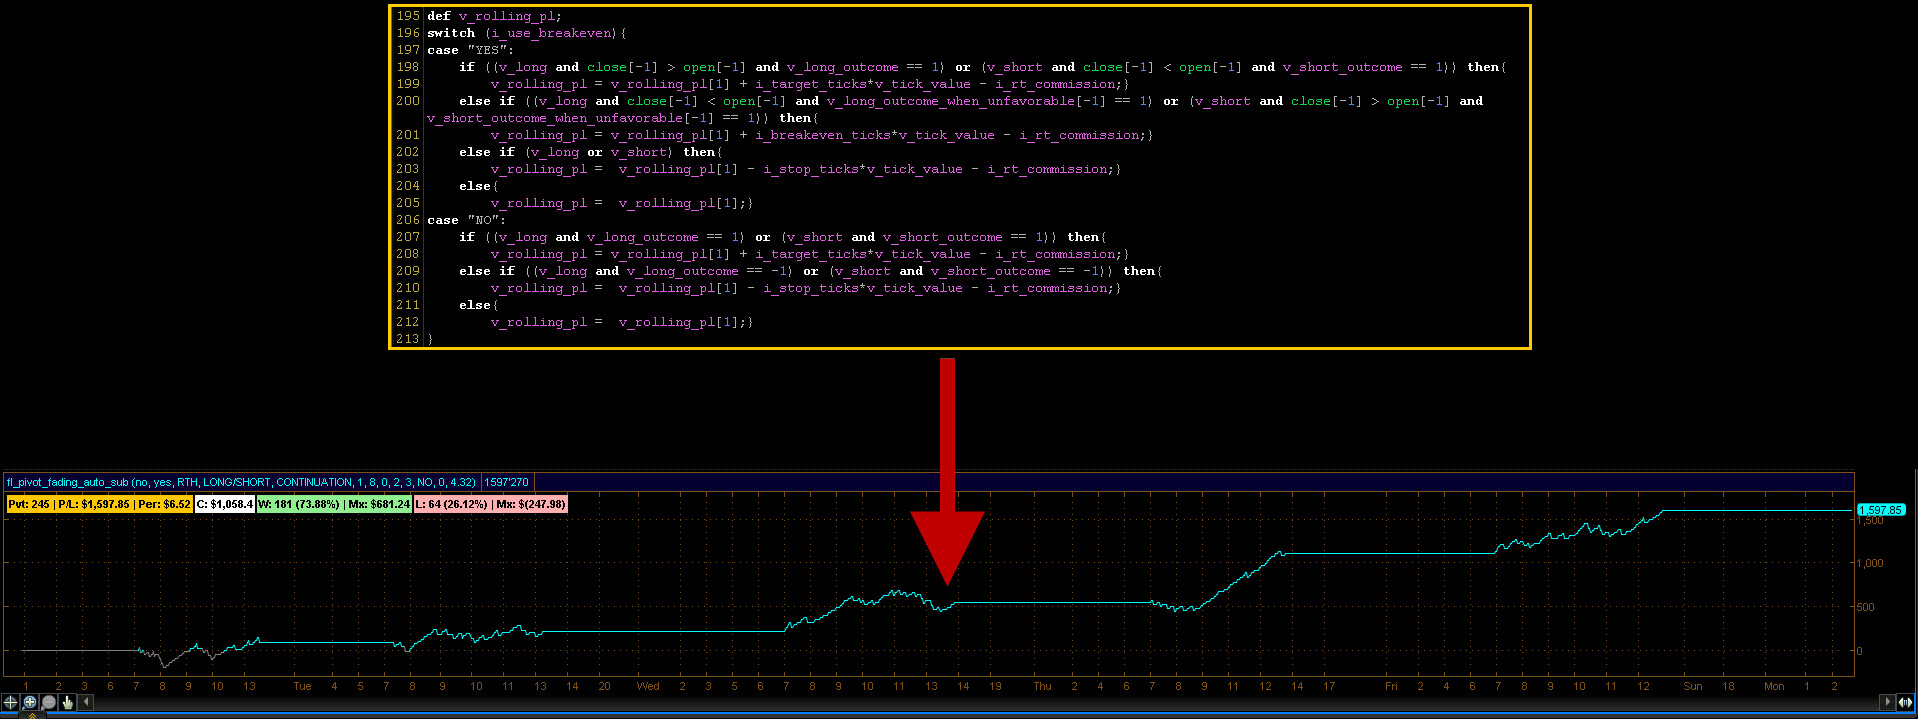
Click image to view full size.
This construct can be transplanted (with minimal change) to yield the PnL plot for any number of different strategies.
What about statistics? Simple:
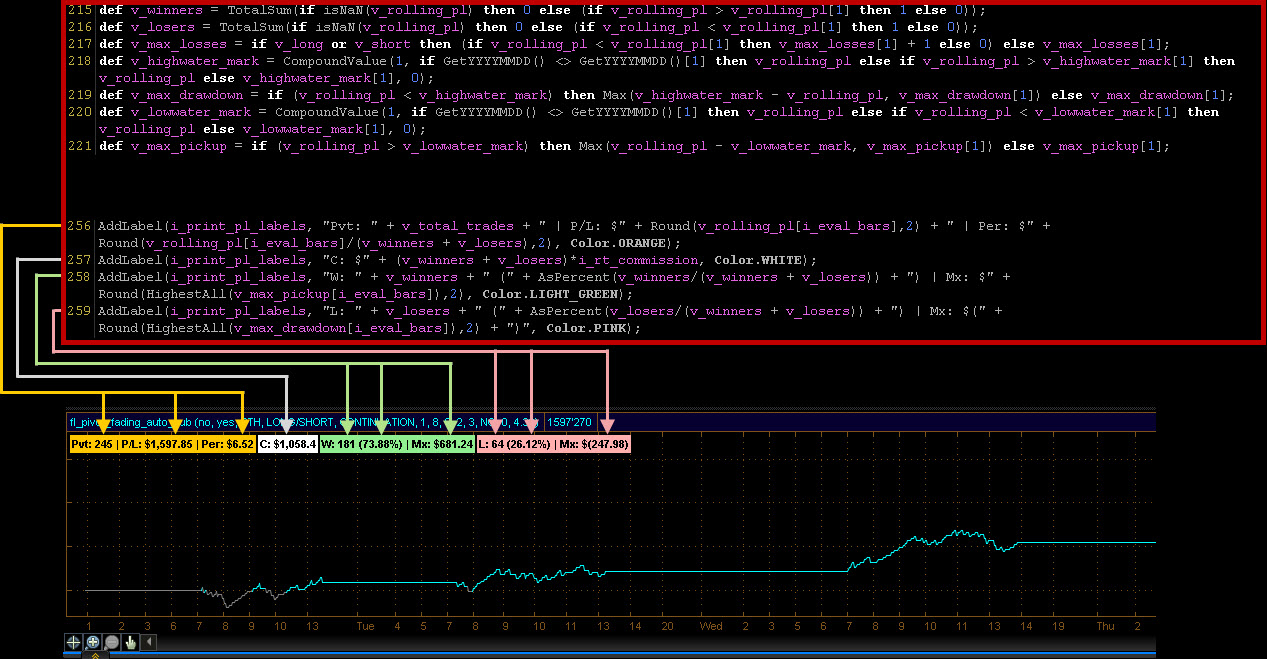
Click image to view full size.
And so it goes.
Hopefully the tie-in to “thinking forward” is made evident through these summarized examples. Could the strategy exist without the configurability of trade direction, for example? Absolutely. But adding this functionality expands the usefulness of the strategy and may very well provide meaningful insight that might have otherwise been overlooked.
For the sake of example, a strategy may run poorly when both long/short trades are executed but have a unique advantage in running solely the short side of the trade logic. An inbuilt configurability switch makes this sort of analysis simple and instantaneous which can often prove to be worth its weight in gold and then some.
Send off…
Admittedly there are some pretty broad steps (leaps even) taken here to get from various points A to points B. In subsequent discussions I’d like to dig deeper into these elements and branch out to new areas as the path unfolds.
In the meantime, happy trading and leave any questions you’d like me to answer in the comments below.
– Fil
About the Author